In this lecture, we want to dive into the network and find intuition about how these networks do what they do.
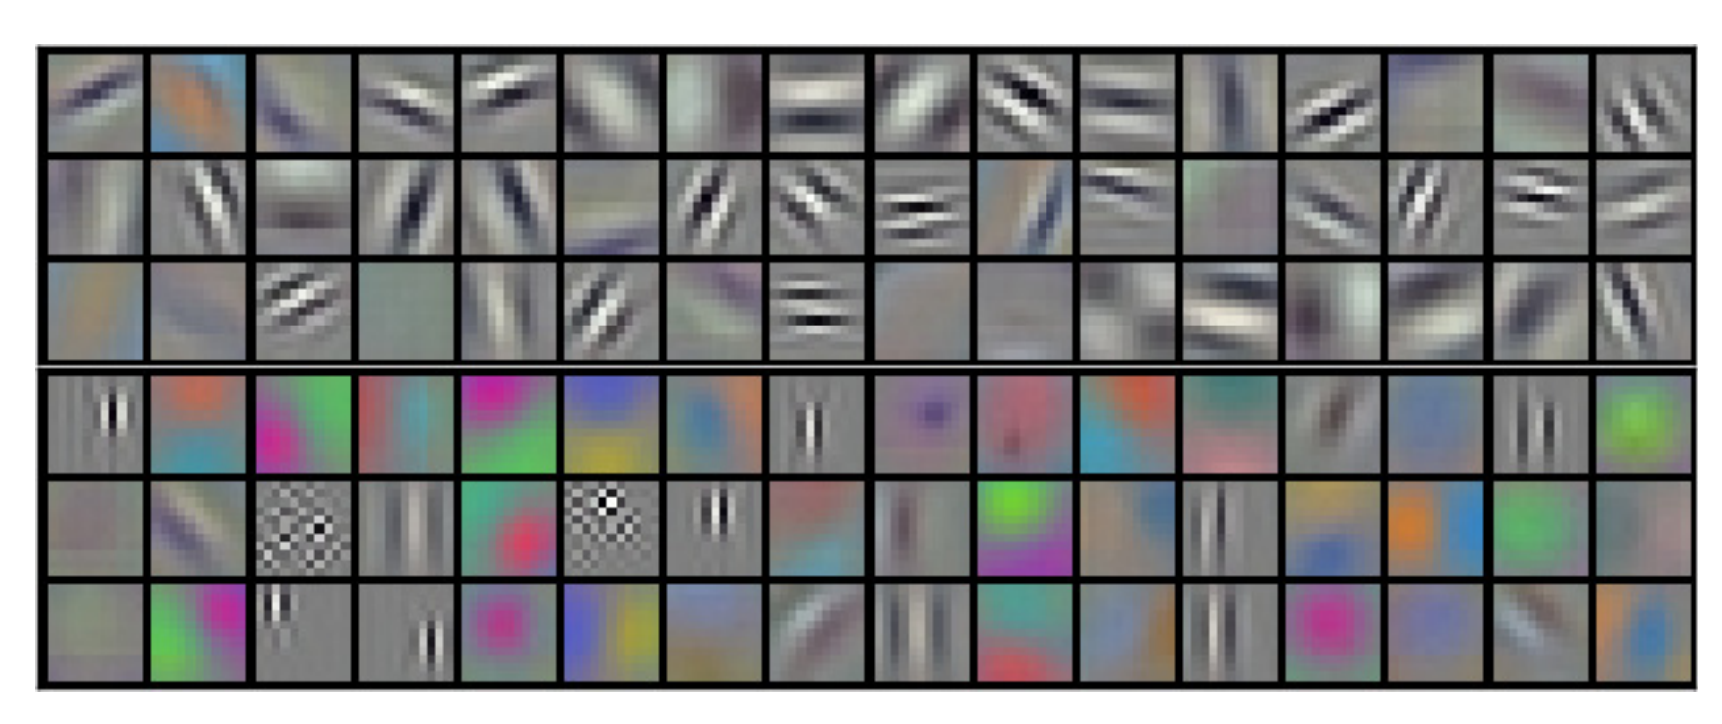
Because the first layer filters are directly inner product with the input image so filter channels are the same as the input image, then we could visualize filters themselves as images. By visualizing them, we could see what feature each filter is looking for. It turns out first layer filters look for fundamental features like edges or colors. It also explains why transfer learning works. In various problems, first layer feature map transfer is similar and could be reused.
96 filters learned in the first convolution layer in AlexNet
But visualizing higher-level filters is tricky. Because the number of channels for each filter relies on the number of filters in the previous layer, they couldn't visualize as RGP or grayscale images. Each channel could be visualized as a grayscale image. The second problem is if you visualize the higher-level filters anyway, they are not interpretable easily. the higher-level layer input comes from previous layers. We don't know exactly what they mean in terms of pixels.
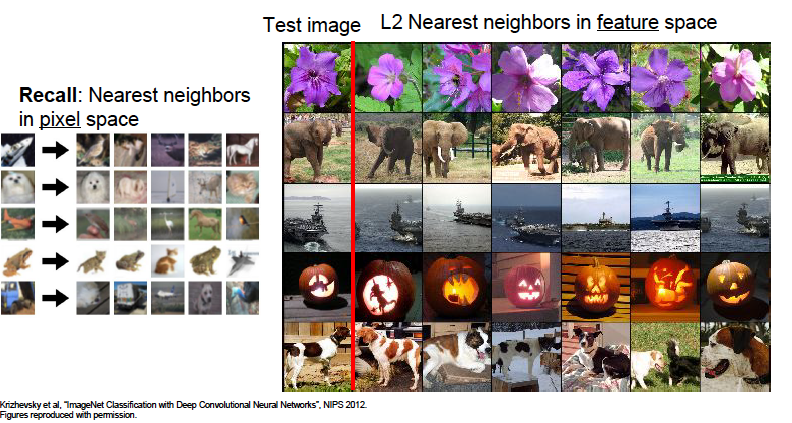
Let's look at the layer exactly before the last layer that calculates scores for images. This layer output contains the most high-level features extracted from the image. If we do nearest-neighbor classification on this feature vector to group the images, it works very well despite there aren't many similarities between raw pixels. So we could conclude that the network attends to the semantic of the pictures, not raw pixels.
We realized that understanding the middle layer by visualizing their filters is not much practical but when visualizing the activation map of the middle layer for a specific input, considerable results come out. For example, we could see the specified activation map from the activation volume is sensitive to faces.

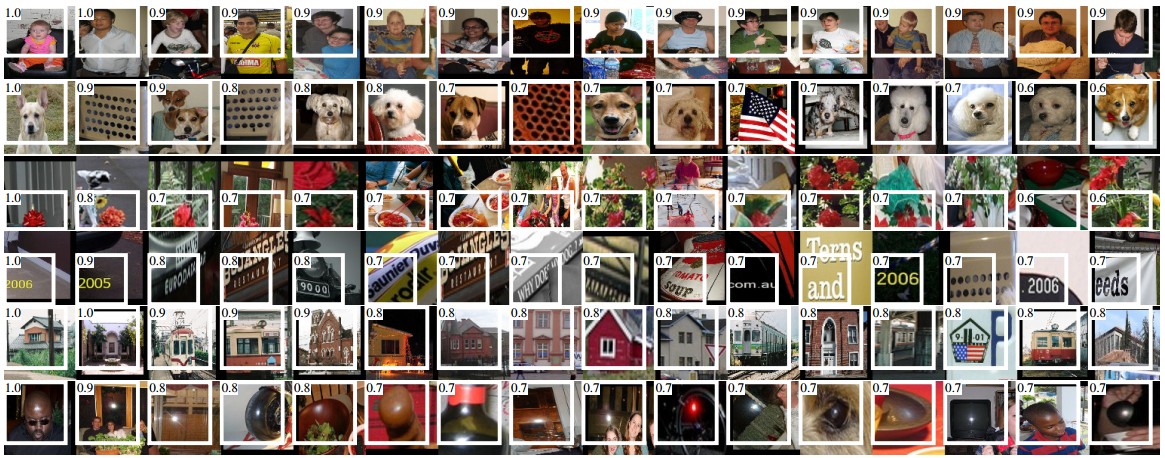
If you choose a channel for a specific layer from the network and run the network through a bunch of input data, then sort input that maximally activates the activation map, you could get exciting results. For example, each row in the image corresponds to images that maximize specific neurons in a network layer. If we look closely, we could see, for example, that specific neuron looking for a building in one row left to last.
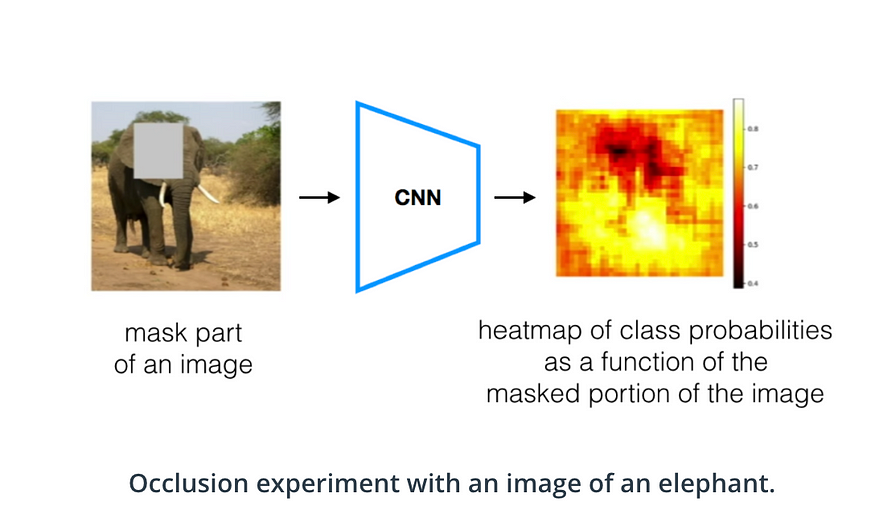
Another cool experiment that could be used to understand the network better is the occlusion experiment. In the occlusion experiment, we replace one part of the image by the mean of the training set and track how the changed image influenced the score of classification. We could make a heat map to visualize the important parts. By this technic, we could understand what part of the image has more influence on the network decision.